This dataset validation report plots a sample of values from the NASA IMERG analysis, late dataset over time and across space, comparing where possible to a previously validated reference dataset. It also reports the quantity of unavailable values and their associated timestamps. These analyses are one layer of a multi-layered dataset validation process we perform at dynamical.org and also provide users a preview of the dataset contents.
Report generation start time: 2026-07-24T03:58:12 UTC
Summary
This dataset has been reviewed and is ready for use. One note for users: the precipitation quality index reflects a change in the underlying satellite observing system partway through the record (see review notes below). Precipitation magnitudes themselves are unaffected.
What looks good
- A complete 30-minute record spanning the full IMERG era, 1998-01-01T00:00 through 2026-07-23T08:30 (500,658 timesteps), on the expected 0.1-degree global latitude/longitude grid.
- Geometry and units are correct: precipitation is reported as a rate in
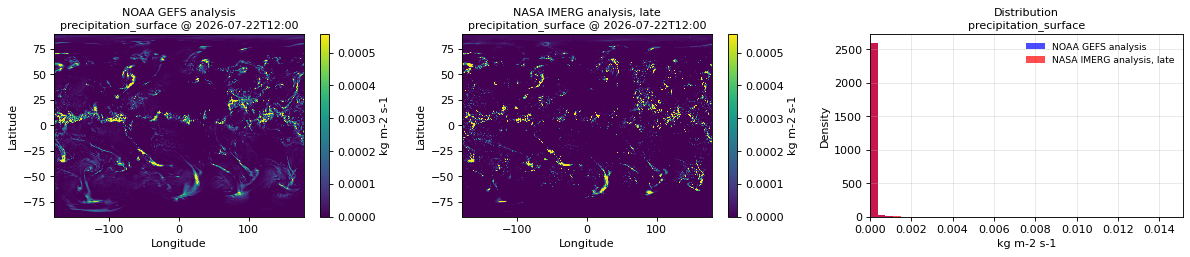
kg m-2 s-1and the quality index is dimensionless (1). - Precipitation is physically reasonable and agrees closely with the independent NOAA GEFS reference. At the 2026-07-22T12:00 snapshot the global spatial mean is 2.77e-05
kg m-2 s-1for IMERG versus 3.02e-05kg m-2 s-1for GEFS, with matching spatial structure and a matching value distribution. - No discontinuity is visible across the 2026-03 transition from IMERG version V07B to V07C.
- The quality index stays within its expected [0, 1] range throughout the record.
- In the recent GPM-era record, missing values are minimal — roughly 0.3-0.6% of grid cells at a given time, seasonally varying and concentrated toward the poles. No timestep anywhere in the archive is entirely empty (no all-NaN gaps). Coverage is lower and more variable earlier in the record (see review notes).
Review notes
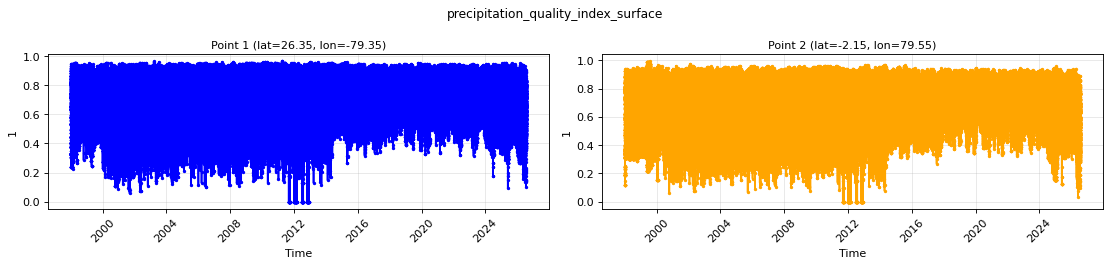
- The precipitation quality index shows a shift in its typical level around 2014, when the source observing system transitioned from the TRMM era to the GPM Core Observatory era. This is a genuine change in the input measurement system, not a data error, and it does not affect the precipitation rate magnitudes.
- Spatial coverage is lower and more variable earlier in the record. Through roughly 2014 (the TRMM era, before the GPM Core Observatory) a larger share of grid cells are unmeasured at any given time — concentrated toward the poles, but also appearing as scattered gaps between satellite overpasses at lower latitudes — and coverage tightens from about 2014 onward. Precipitation values where present are unaffected.
Datasets
| Role | Name | ID | Version | URL |
|---|---|---|---|---|
| Validation | NASA IMERG analysis, late | nasa-imerg-analysis-late |
v0.1.0 |
s3://dynamical-nasa-imerg/nasa-imerg-analysis-late/v0.1.0.icechunk |
| Reference | NOAA GEFS analysis | noaa-gefs-analysis |
0.1.2 |
s3://dynamical-noaa-gefs/noaa-gefs-analysis/v0.1.2.icechunk/ |
Run parameters
| Parameter | Value |
|---|---|
| Validation dataset type | analysis |
| Validation time range | time 1998-01-01T00:00 → 2026-07-23T08:30 |
| Reference time range | time 2000-01-01T00:00 → 2026-07-23T18:00 |
| Point 1 | lat=26.3500, lon=-79.3500 |
| Point 2 | lat=-2.1500, lon=79.5500 |
| Spatial comparison time | 2026-07-22T12:00 (reference at 2026-07-22T12:00) |
| Timeseries period | 2002-11-16T09:01 - 2002-11-26T09:01 |
Availability
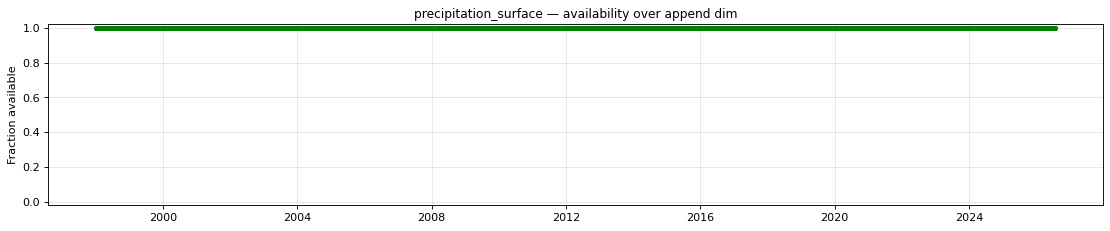
The plot below shows the availability of each variable over time — light red marks unavailable data, dark green marks present data.
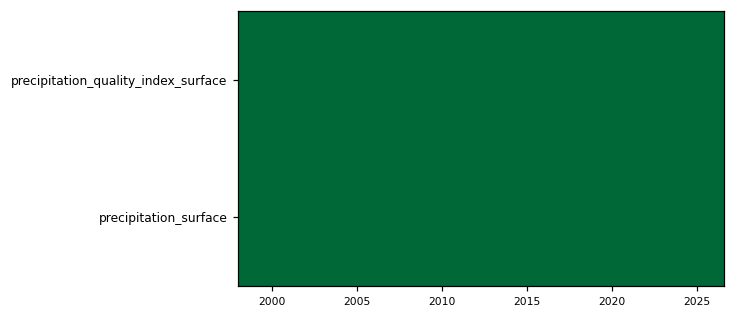
Every variable is complete at every scanned position.
Per-variable details
precipitation_quality_index_surface
Metadata
| Field | Value |
|---|---|
| units | 1 |
| long_name | Quality index for precipitation |
| short_name | pqi |
| standard_name | n/a |
| step_type | avg |
Point time series — 1998-01-01T00:00 - 2026-07-23T08:30
| Point | min | mean | max |
|---|---|---|---|
| P1 | 0 | 0.7173 | 0.9648 |
| P2 | 0 | 0.6954 | 0.9922 |
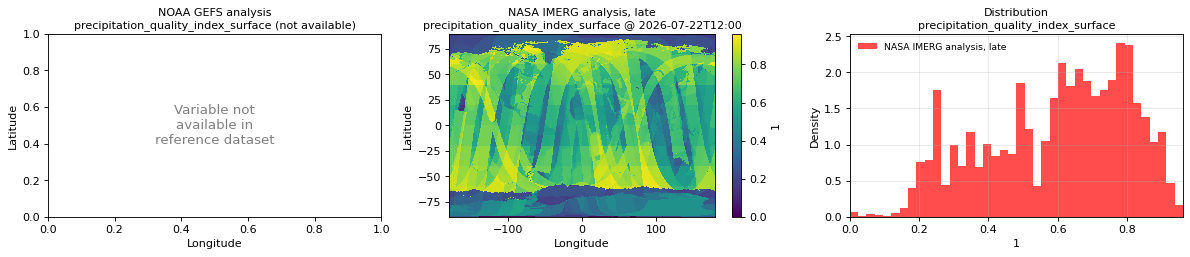
Spatial — 2026-07-22T12:00 (reference not available)
| Source | min | mean | max |
|---|---|---|---|
| Validation | 0 | 0.5994 | 0.9609 |
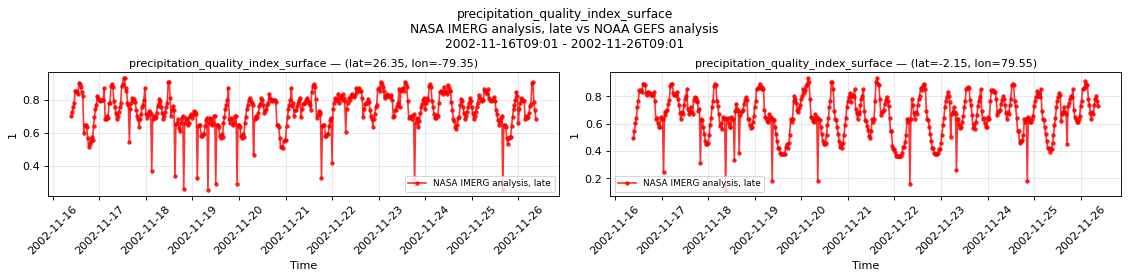
Temporal — 2002-11-16T09:01 - 2002-11-26T09:01
| Source | min | mean | max |
|---|---|---|---|
| P1 Validation | 0.249 | 0.7325 | 0.9336 |
| P2 Validation | 0.1108 | 0.6639 | 0.9375 |
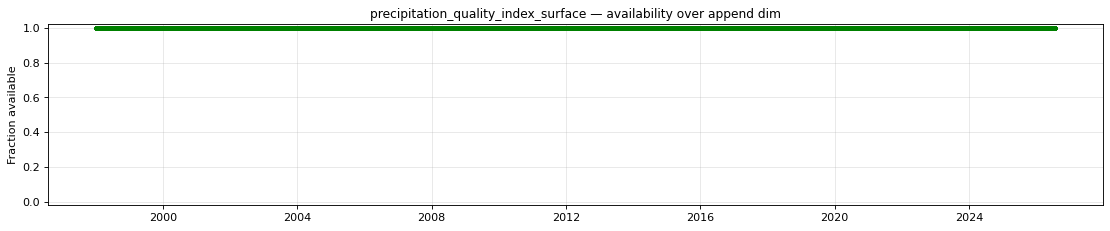
Availability — 500658 of 500658 positions complete; nulls P1 0/500658, P2 0/500658
precipitation_surface
Metadata
| Field | Value |
|---|---|
| units | kg m-2 s-1 |
| long_name | Precipitation rate |
| short_name | prate |
| standard_name | precipitation_flux |
| step_type | avg |
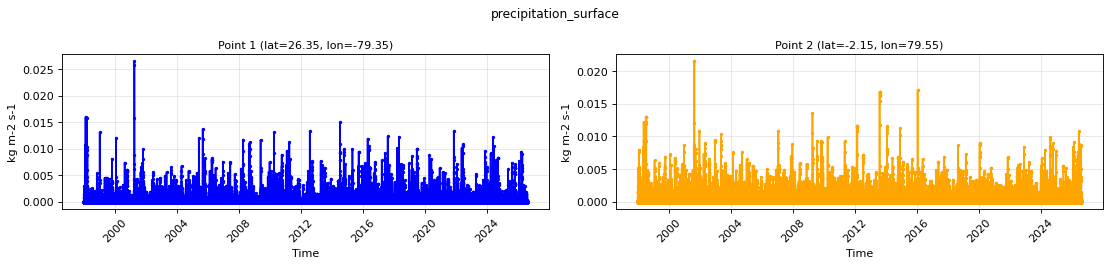
Point time series — 1998-01-01T00:00 - 2026-07-23T08:30
| Point | min | mean | max |
|---|---|---|---|
| P1 | 0 | 4.238e-05 | 0.02649 |
| P2 | 0 | 7.808e-05 | 0.02148 |
Spatial — 2026-07-22T12:00 (reference at 2026-07-22T12:00)
| Source | min | mean | max |
|---|---|---|---|
| Validation | 0 | 2.766e-05 | 0.01514 |
| Reference | 0 | 3.016e-05 | 0.007568 |
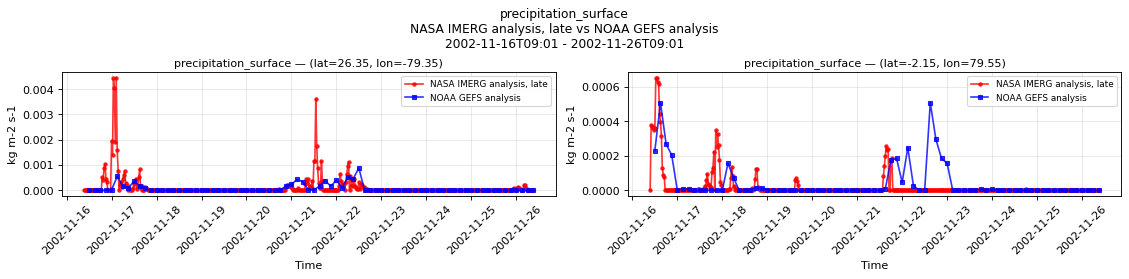
Temporal — 2002-11-16T09:01 - 2002-11-26T09:01
| Source | min | mean | max |
|---|---|---|---|
| P1 Validation | 0 | 0.0001142 | 0.004456 |
| P1 Reference | 0 | 7.429e-05 | 0.000885 |
| P2 Validation | 0 | 2.193e-05 | 0.0006523 |
| P2 Reference | 0 | 4.198e-05 | 0.0005074 |
Availability — 500658 of 500658 positions complete; nulls P1 0/500658, P2 0/500658